You haven't signed in yet, you can have a better experience after signing in
*Please complete the payment within {{receiveCouponInfo.expire_at}}Previous use*
You haven't signed in yet, you can have a better experience after signing in
 IMindQ Professional Multi functional Mind Mapping Tool Software
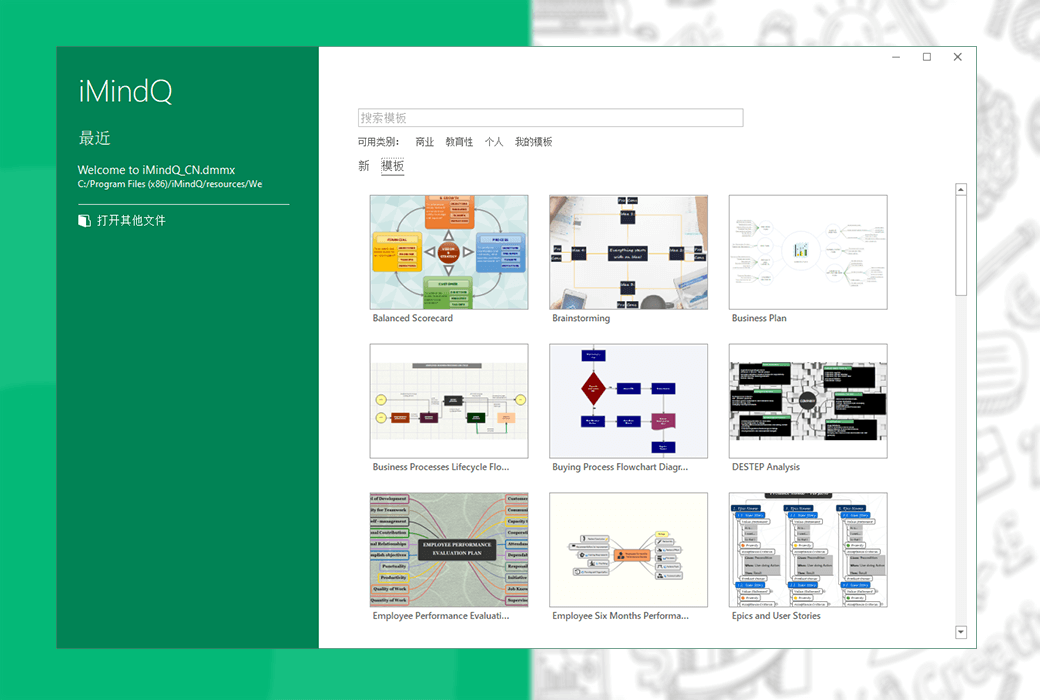
Activity Rules
1、Activity time:{{ info.groupon.start_at }} ~ {{ info.groupon.end_at }}。
1、Activity time:cease when sold out。
2、Validity period of the Group Buying:{{ info.groupon.expire_days * 24 }} hours。
3、Number of Group Buying:{{ info.groupon.need_count }}x。
Please Pay Attention
1、Teamwork process: Join/initiate a Group Buying and make a successful payment - Within the validity period, the number of team members meets the activity requirements - Group Buying succeeded!
2、If the number of participants cannot be met within the valid period, the group will fail, and the paid amount will be refunded in the original way.
3、The number of people required and the time of the event may vary among different products. Please pay attention to the rules of the event.
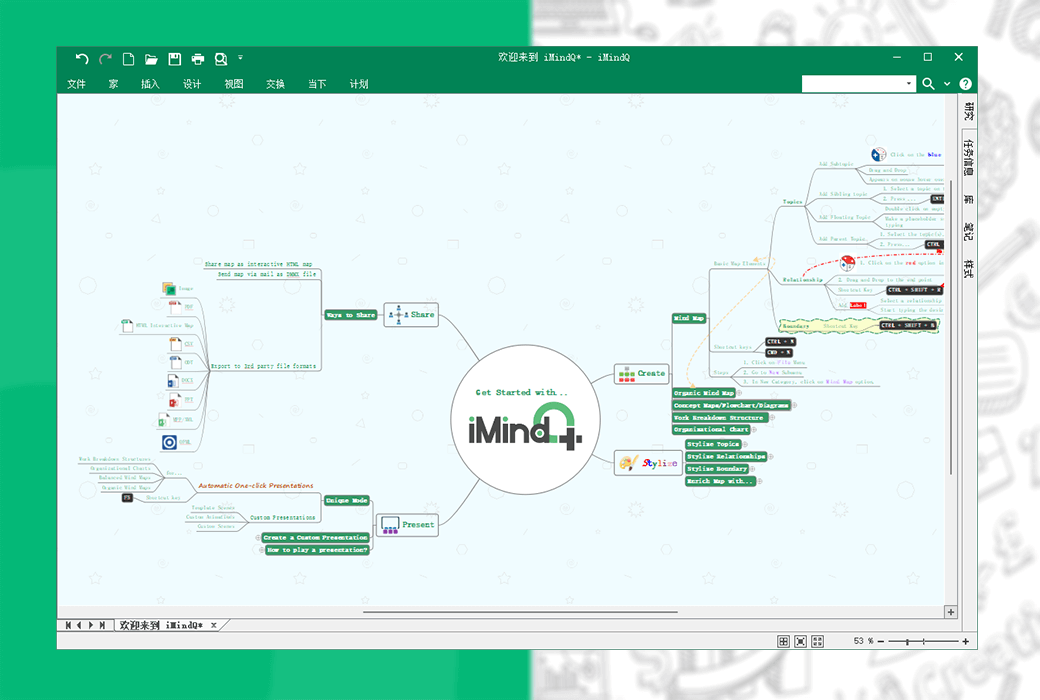
IMindQ Professional Mind Mapping Software
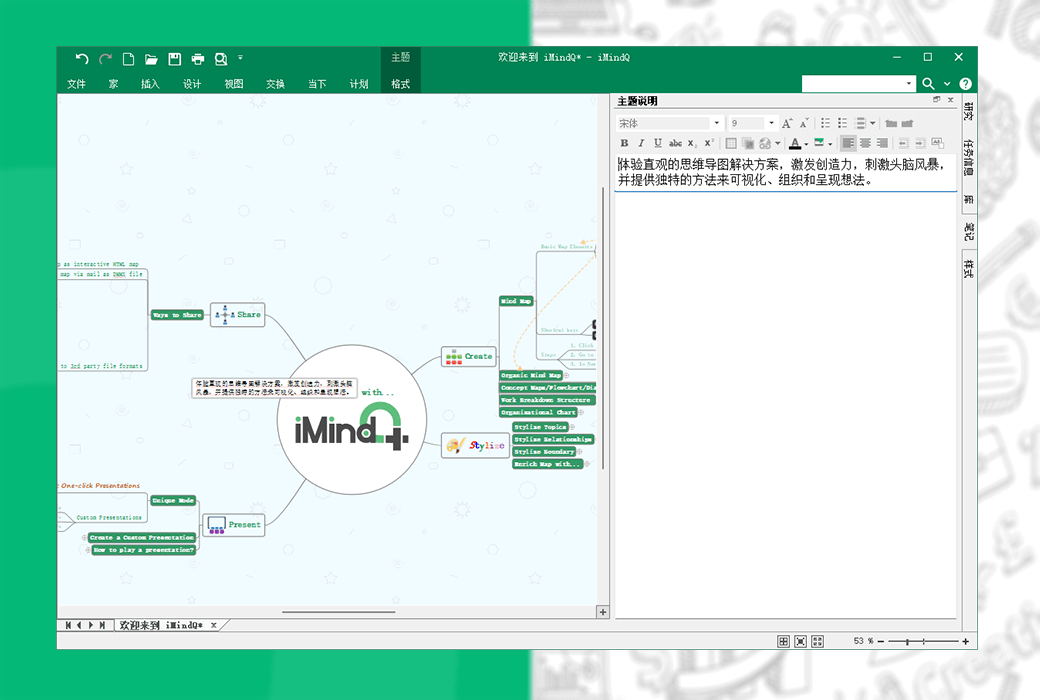
Experience intuitive mind mapping solutions, inspire creativity, stimulate brainstorming, and provide unique ways to visualize, organize, and present ideas.
IMindQ is positioned as a professional mind mapping software and is an excellent tool that integrates multiple types of mind mapping styles. It can be used for business, education, and personal purposes, and can be used by any department of an organization, school system, or university. In addition, iMindQ can also help individuals inspire learning, organize, and visually present ideas.
Mind maps, concept maps, flowcharts, Gantt charts, organizational charts, WBS charts, and other types of charts are increasingly being used to present key information in a format that is relatively easy to remember and understand. These charts are best created using iMindQ. It is a great tool when generating new ideas or attempting to maximize the use of a large amount of work or information overload.
How can iMindQ help you?
A concept map is a visual representation of concepts and ideas connected around a central concept.
Brainstorming meetings through mind maps can ensure team members' understanding, memory, and increased participation.
Plan the project by creating a WBS based on deliverables and visually analyze the results using a Gantt chart view.
Just one click to present your mind map, leaving a powerful visual impact and providing an overview of the entire topic.
Collaborate and share ideas with friends and colleagues through a unique HTML mind map experience.
IMindQ Use Case
Explore numerous practical scenarios where mind maps can be used in education.
Mind maps have applications in many fields of business. Take a look at some of our use cases.
As a technology, mind maps can be used to improve and organize many of your activities and daily habits.
Daily use of iMindQ
IMindQ provides a flexible set of features suitable for both business and personal use. Browse some of these features and see how they can help you turn your ideas into reality.
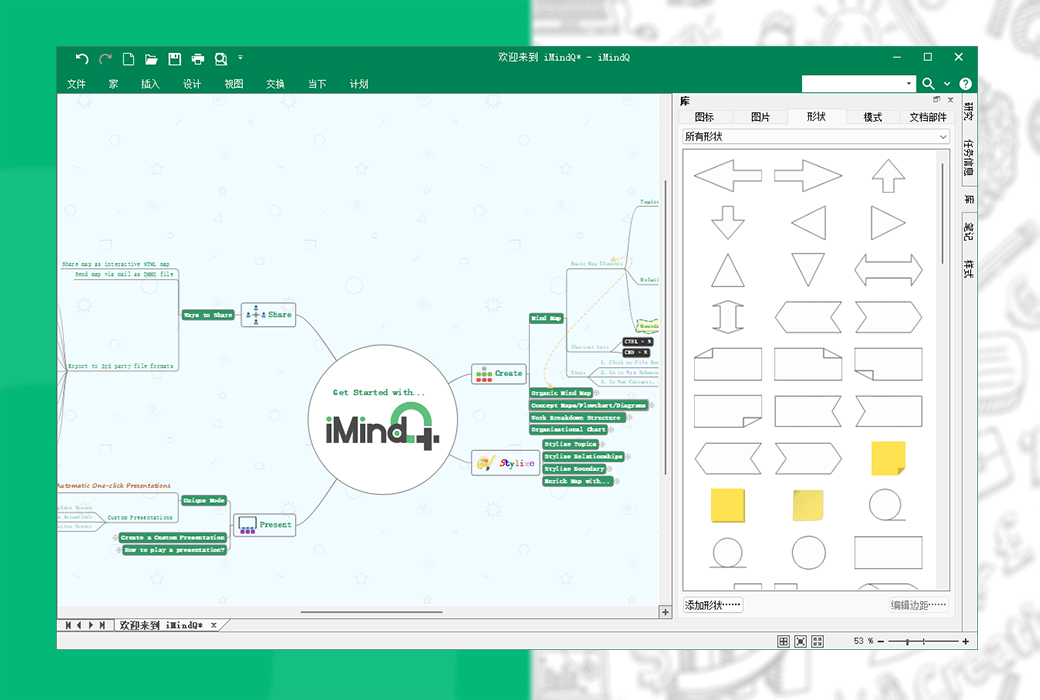
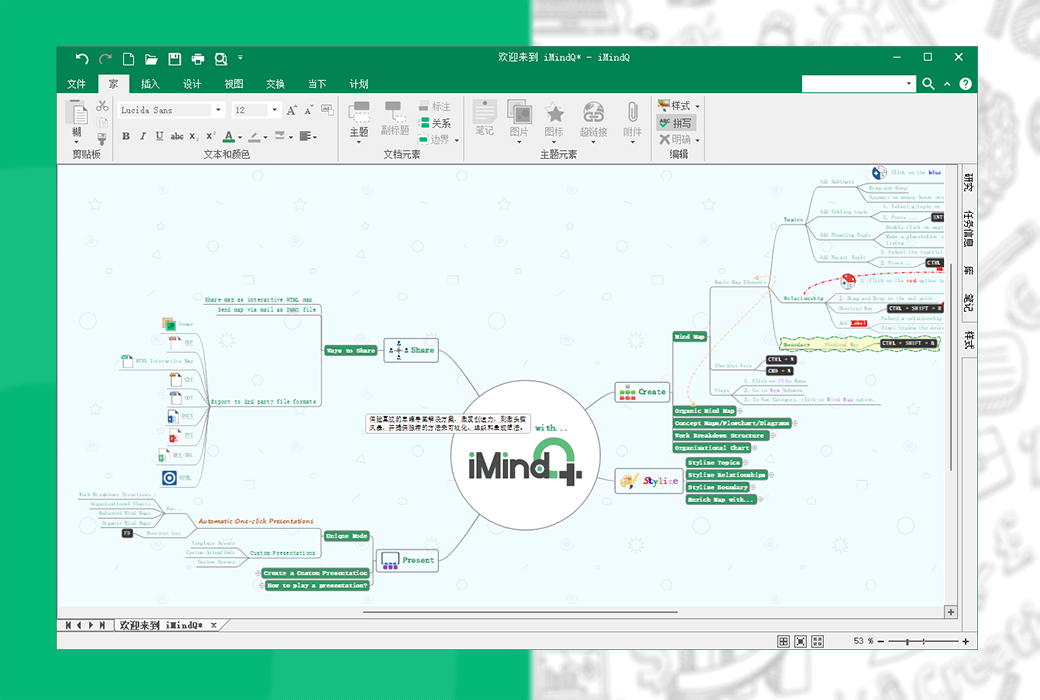
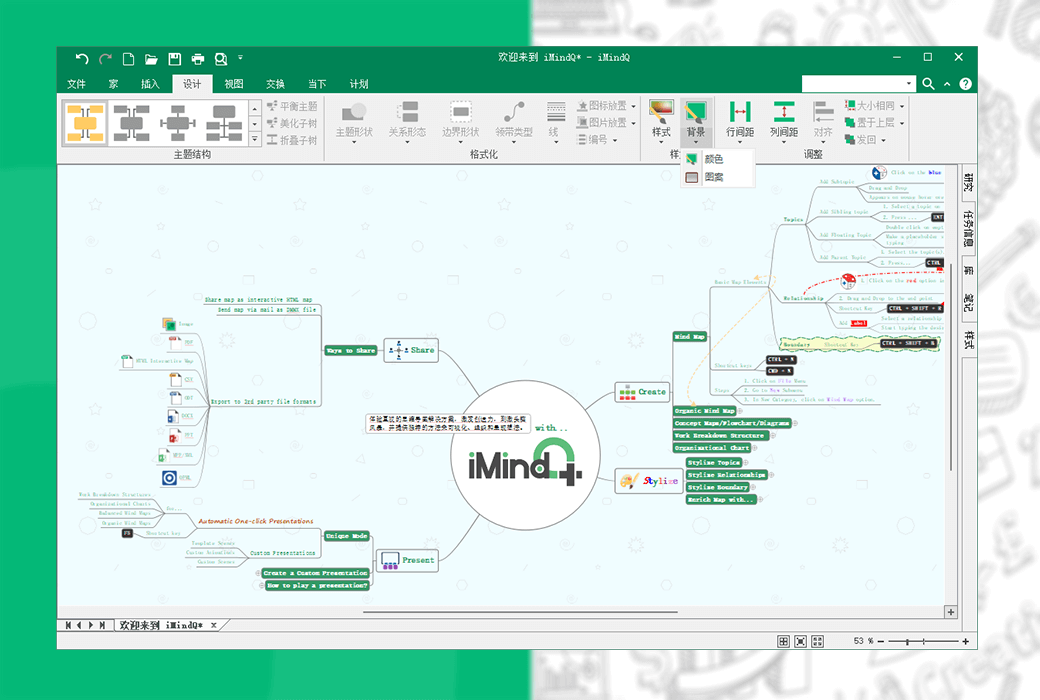
Personalize the appearance of your map by using annotations, icons, images, hyperlinks, alerts, and other rich map themes You can directly add attachments from your computer and easily manage them, add custom properties, and customize dates and times.
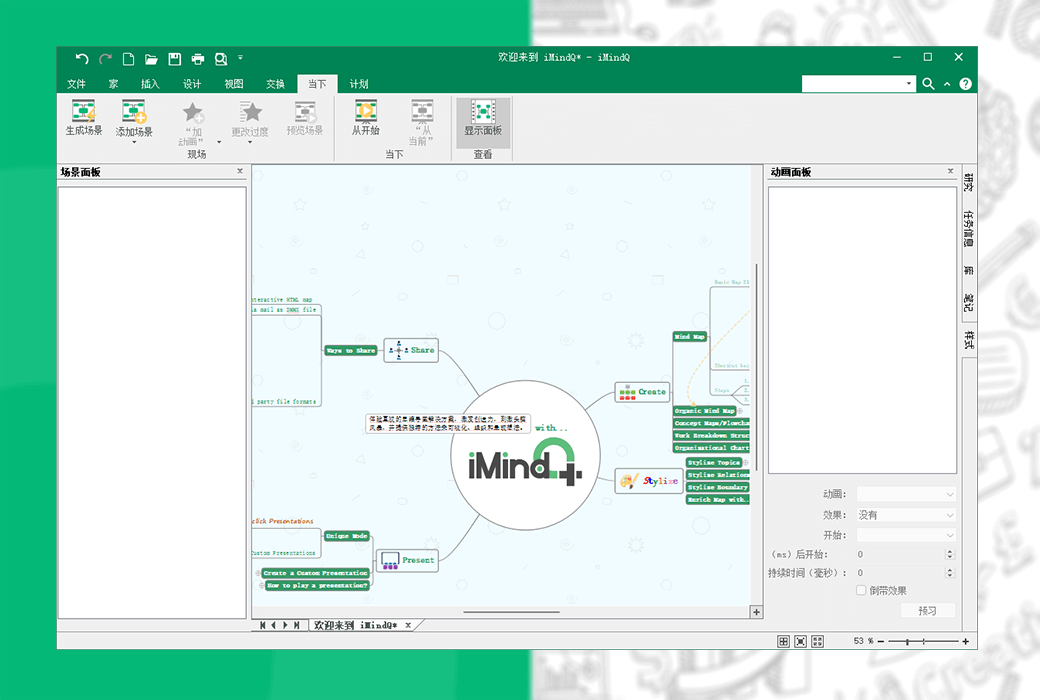
Just click the button to visualize the mind map and ideas. Use the many available options in presentation mode to create your own custom presentation.
Create a WBS, transform your ideas into tasks, and preview them using a Gantt chart view. Add task information such as priority, duration, resources, and constraints.
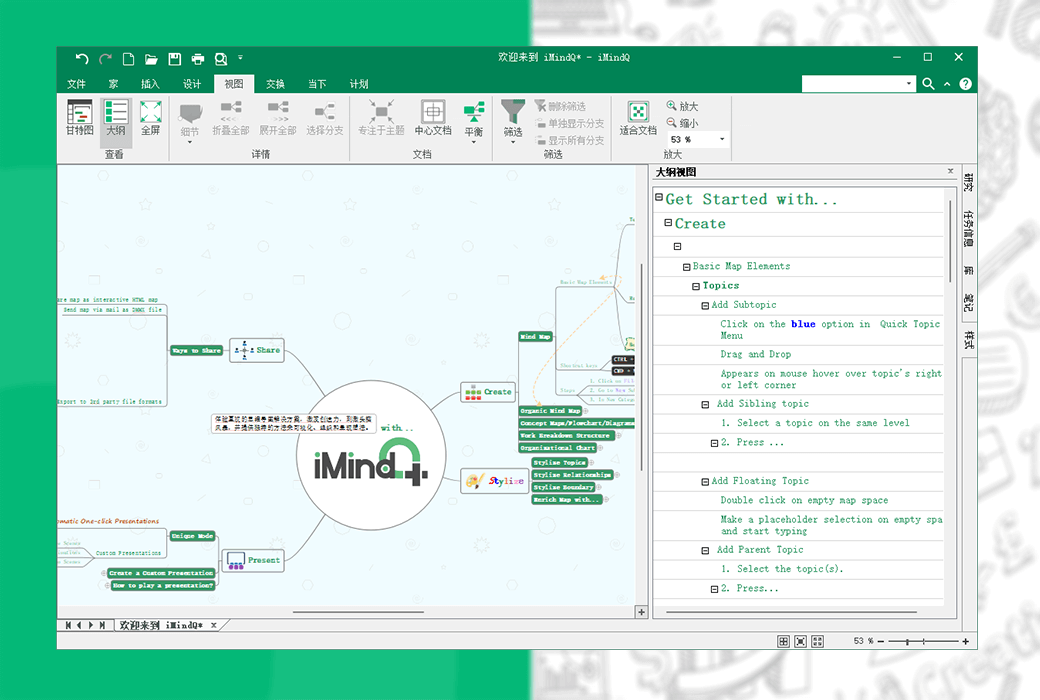
Search for information online while creating a mind map, and simplify the mind map experience with the help of the research panel.
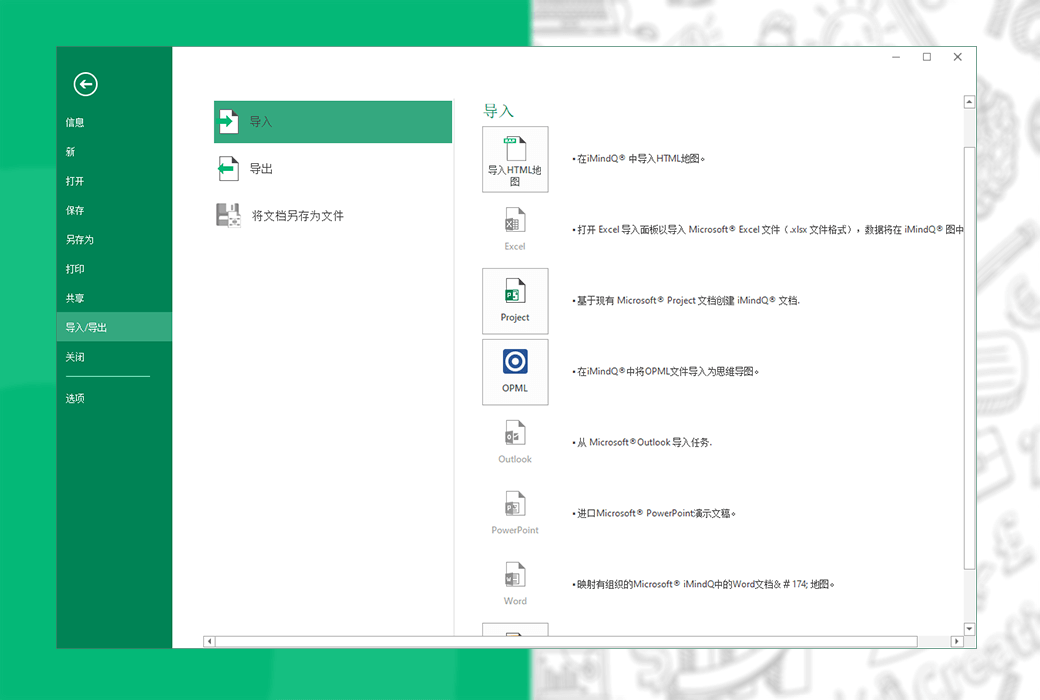
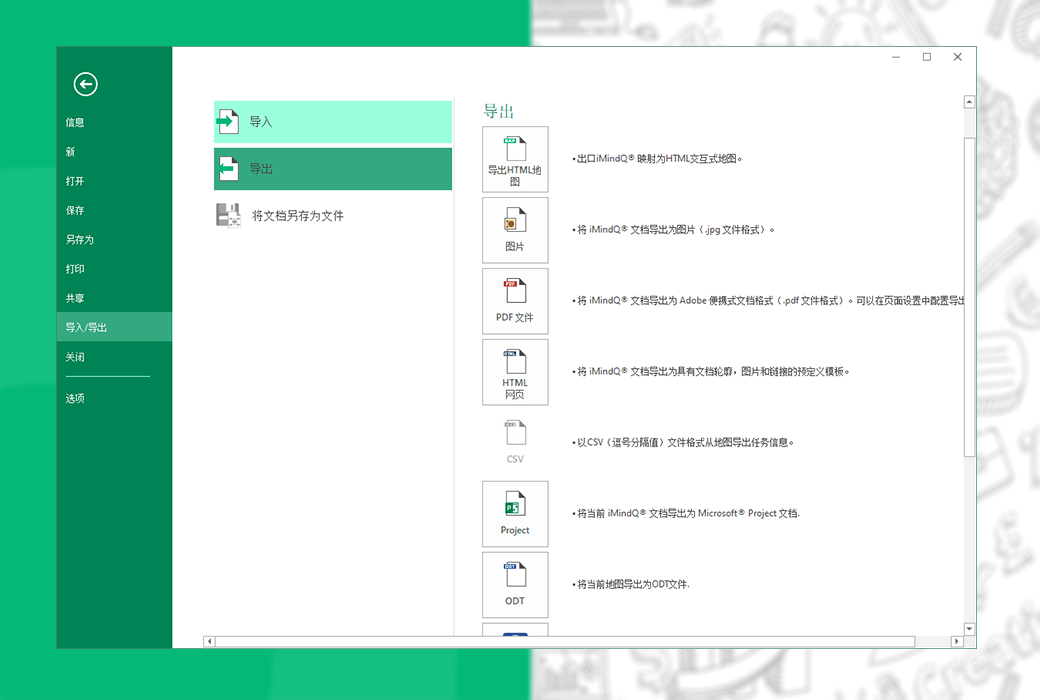
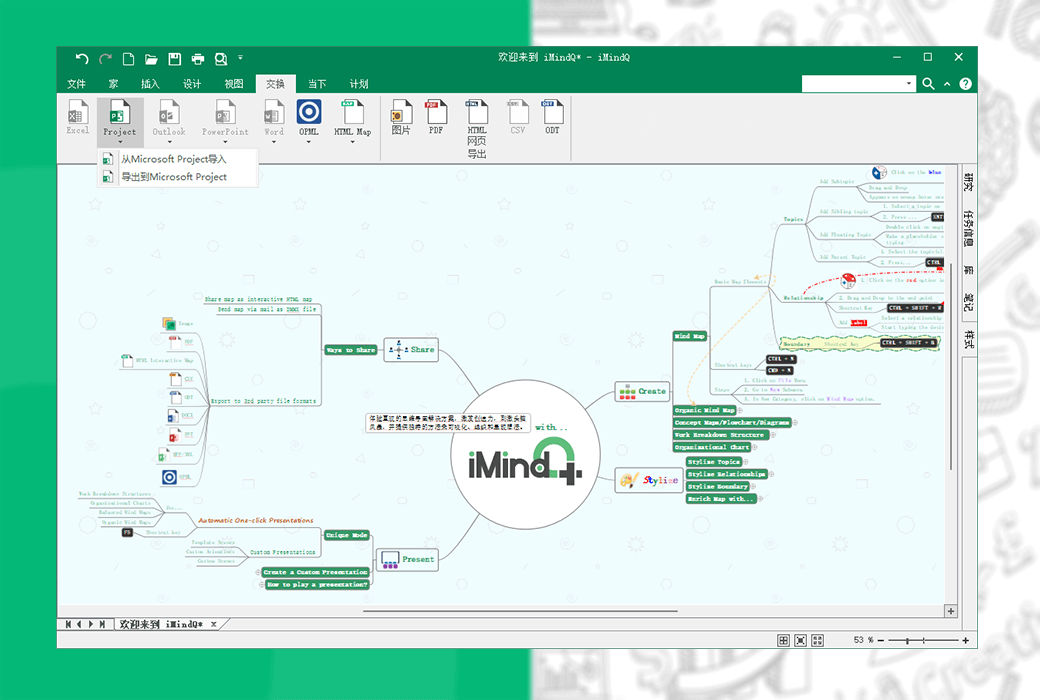
Import or export your mind map in one of the following formats: HTML; Excel(.xlxs); Microsoft Project(.mpp); OPML; PowerPoint(.pptx); Word(.docx); In addition, you can also open mind maps created using MindManager, XMind, and FreeMind.
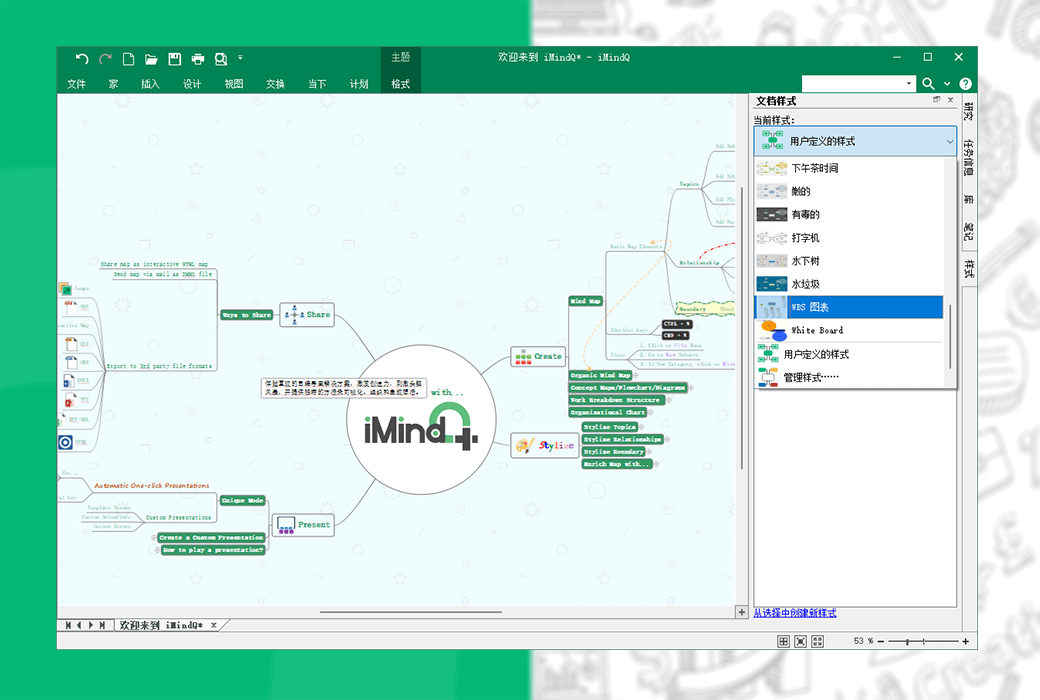
Use the 'Map Style' feature to design the appearance of the map. Choose from a variety of available designs, or create and manage custom styles that best suit your needs.
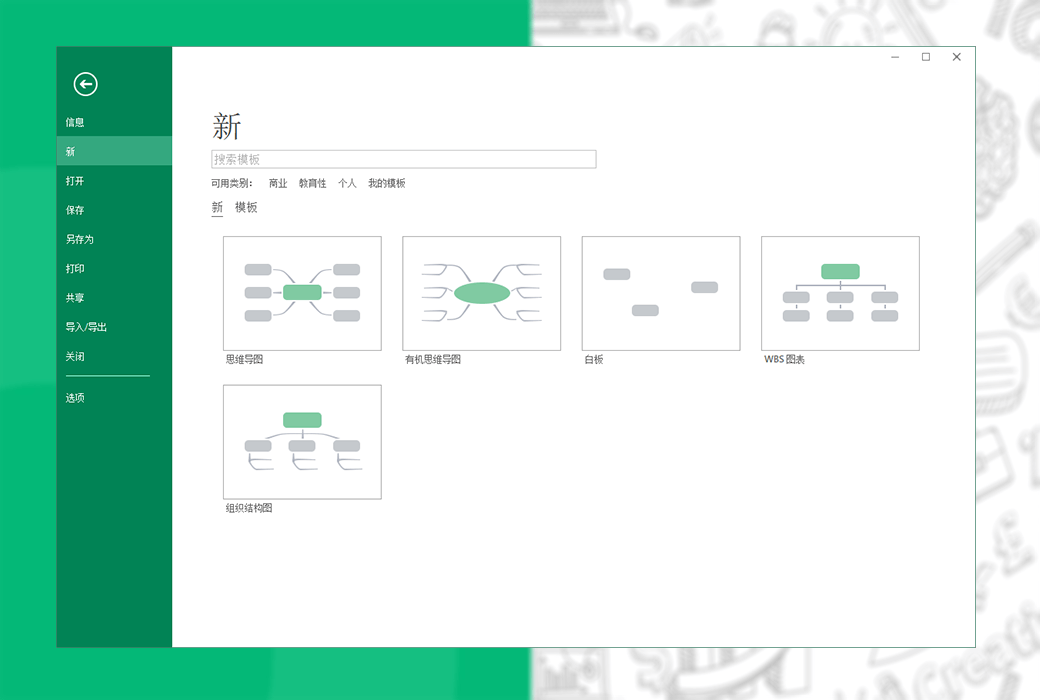
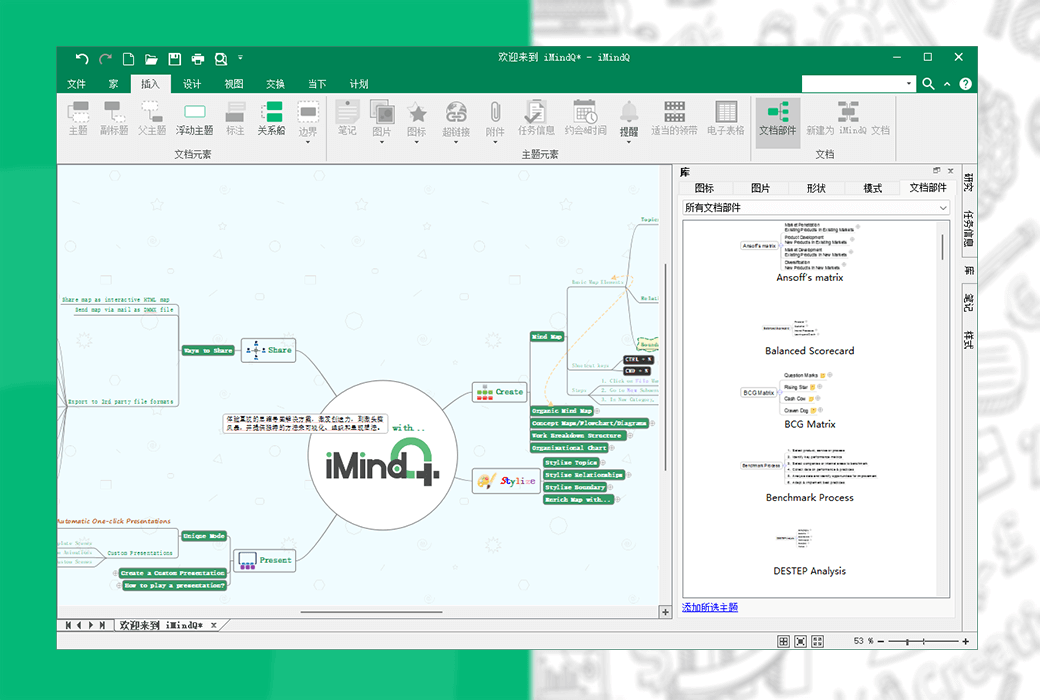
With the help of a mind map template, you can start drawing a mind map with just a few clicks. Whether you are conducting marketing analysis or brainstorming with colleagues, you can rest assured that you will find a template that suits you and your team.
Official website:https://www.imindq.com/
Download Center:https://imindq.apsgo.cn
Backup Download:N/A
Delivery time:Manual processing
Operating Platform:Windows
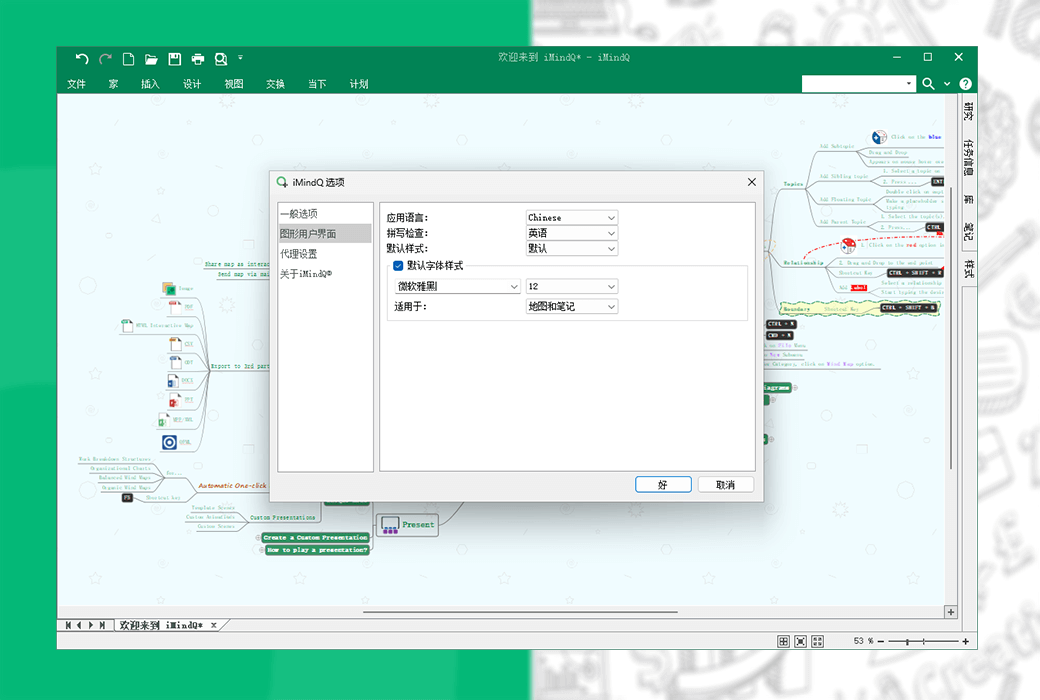
Interface language:Supports Simplified Chinese interface display and supports selection of other languages.
Update Description:Supports one-year maintenance and updates, and can continue to use the current version after one year.
Trial before purchase:Free 15 day trial before purchase.
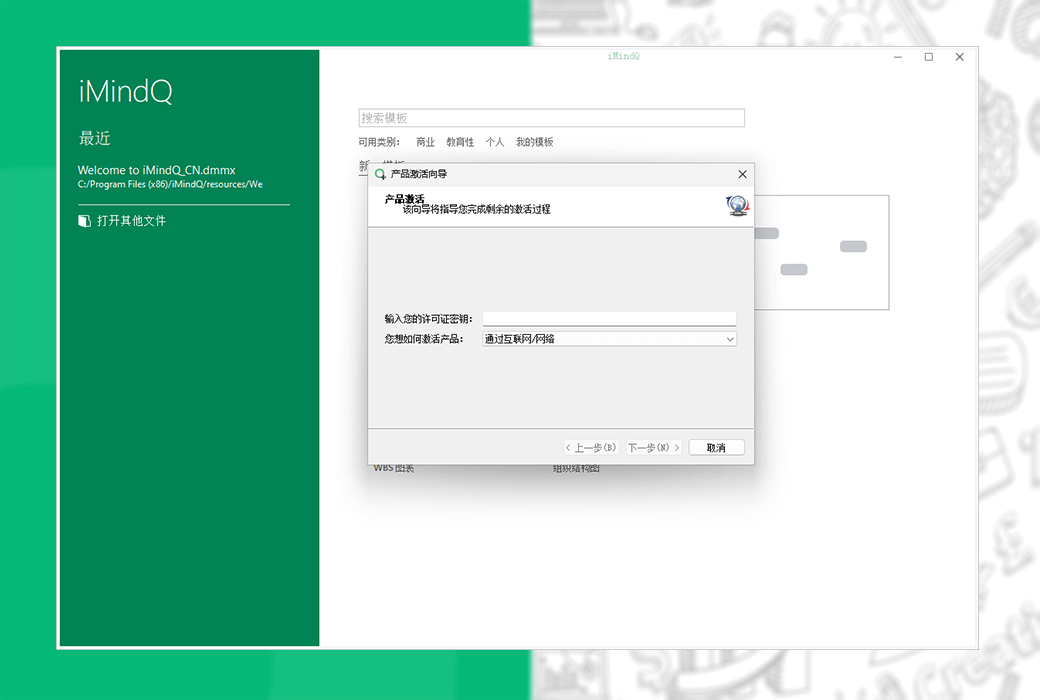
How to receive goods:After purchase, the activation information will be sent to the email address at the time of placing the order, and the corresponding product activation code can be viewed in the personal center, My Orders.
Number of devices:Can install one computer.
Replace computer:Uninstall the original computer and activate the new computer.
Activation guidance:To be added.
Special note:To be added.
reference material:https://synamistore.com/collections/imindq

Any question

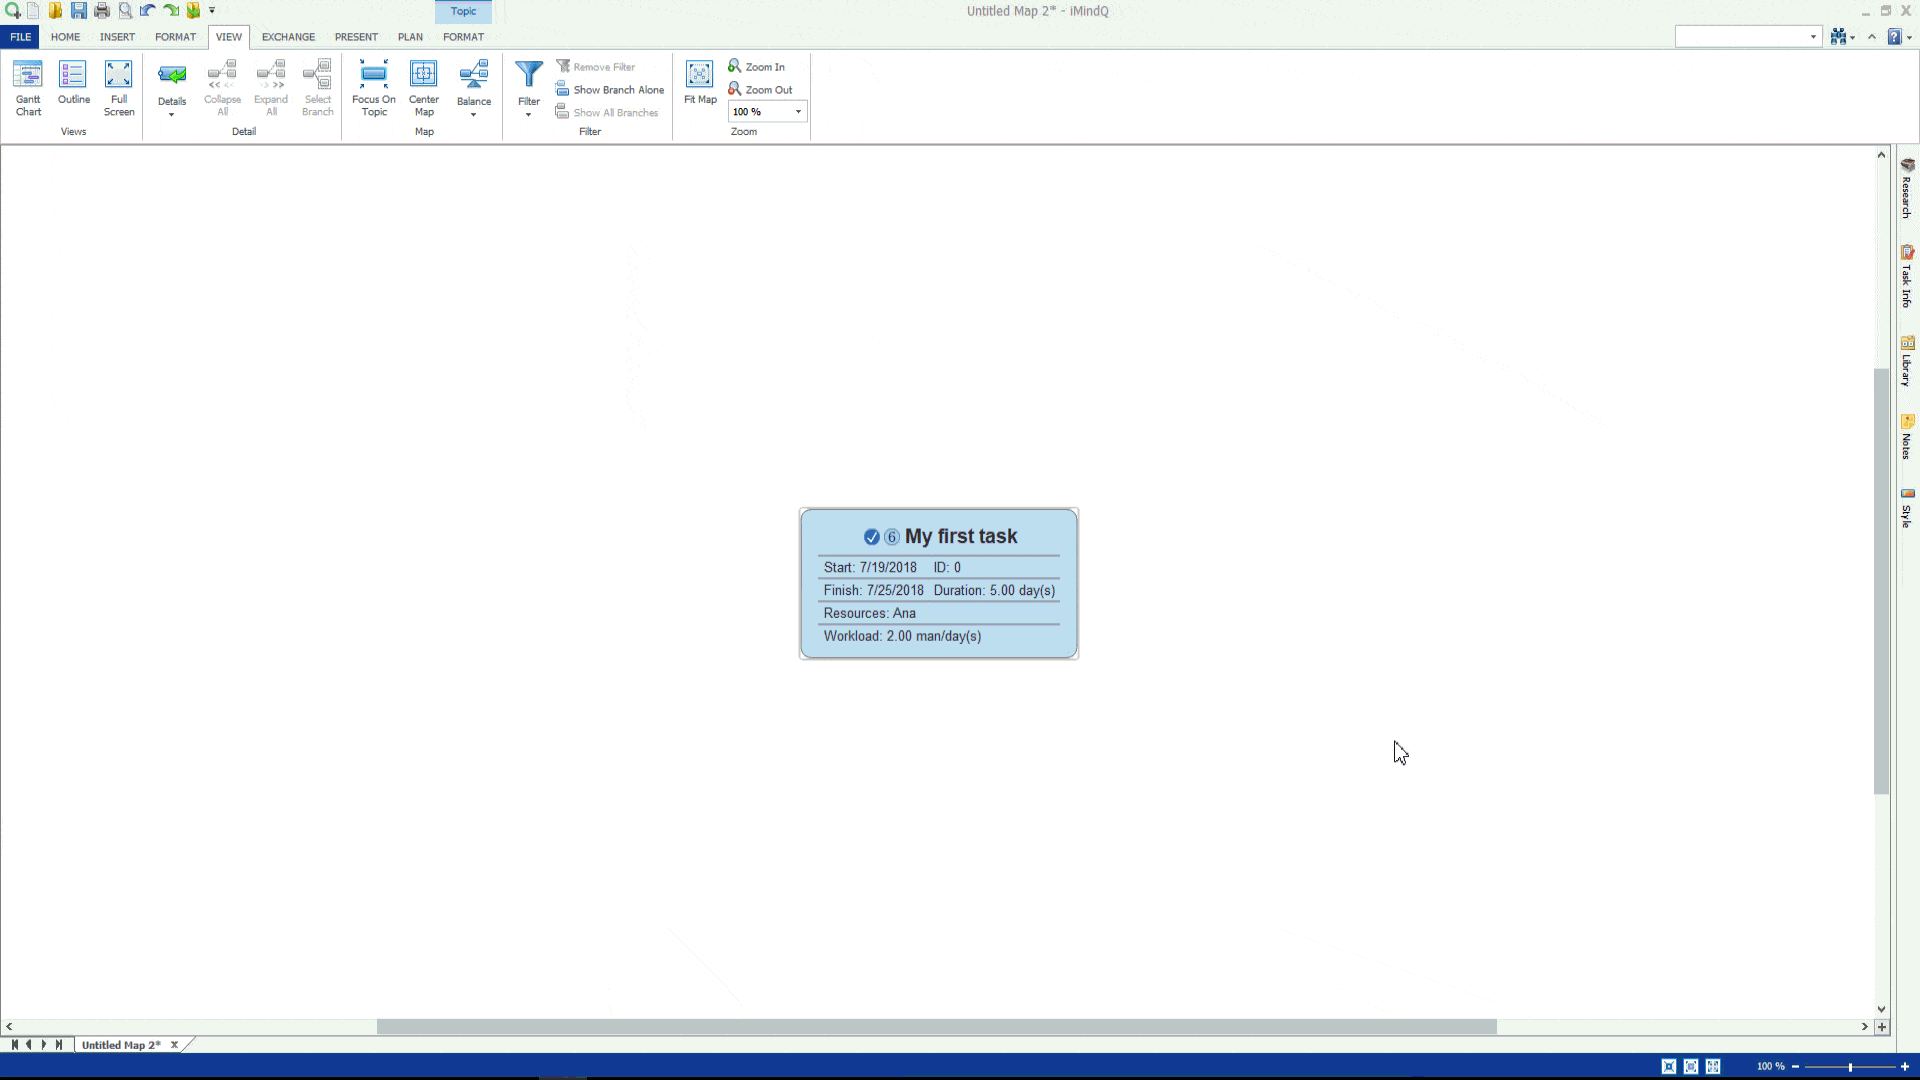
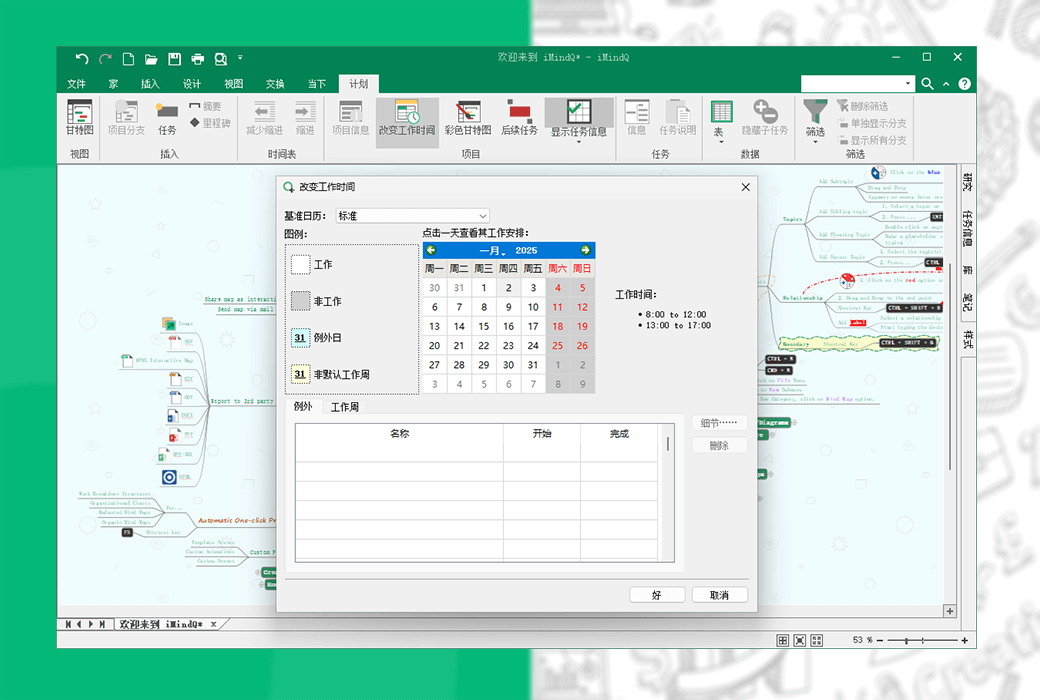
After creating the first task, it is time to familiarize oneself with a different viewing format commonly used for project management, namely the Gantt chart view.
The 'Planning' functional area includes other features that simplify the handling of tasks and projects. From this ribbon, you can select the Gantt chart view.
You can access the same view from the Views Group on the View Ribbon. This operation will divide the workspace, displaying Gantt charts and maps in the workspace.
The Gantt chart view consists of two parts: the Gantt chart located on the left side of the application and the Gantt chart located on the right side.
A Gantt chart (or Gantt chart) consists of columns containing task information. According to the table you are working on, different columns will be displayed in the Gantt chart.
The default table for Gantt charts is the Entry table. You can enter the properties of a task in the Gantt Sheet by typing the corresponding information in the cell, selecting from the drop-down list in the cell, or using the Task Info window.
Task information can also be inserted from the Gantt Chart table by simply drawing custom bars. By double clicking the bar in the Gantt Chart table, the Task Information dialog box will open, where you can add additional information about specific tasks.
You can further customize the appearance of the Gantt chart by selecting the color Gantt chart button from the planned ribbon. This operation will automatically color the bars in the chart table based on the color of the tasks in the map space.